General Page
The IBM Support Assistant saves you time diagnosing and resolving software problems.
Announcement:
IBM Support Assistant Team Server v5.0.2.13 (Update) now available.
Learn more...
|
|
IBM Support Assistant Team Server provides a rich set of problem determination tools and functions to help you investigate software problems. Through a shared application, you can collaborate with others to discover root causes and enhance your productivity. |
|
For more information about IBM Support Assistant Team Server, see the links in the resources section and download it today. |
| Features and Benefits | |
|---|---|
| Problem Determination tools | Use specialized tools to troubleshoot complex problems. Generate analysis reports or interact with rich web-based and desktop tools. |
| Intuitive Web UI | Emphasizing simplicity, Team Server provides browser access to the application and problem determination tools |
| Server-based application | Install once and collaborate with multiple team members. Analysis processing can now be offloaded from your desktop. |
| Case management | Organize diagnostic files by problem incident or other meaningful organization approaches. |
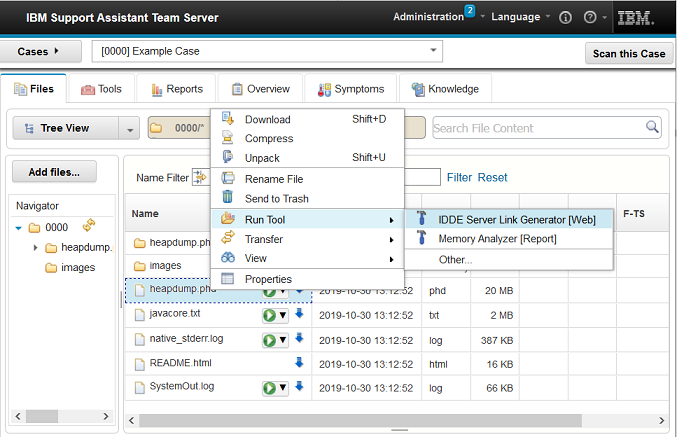
| File management | Quickly navigate through case files and perform various actions including rename, move, and compress directly against the remote files. |
| Automated data analysis | Automatically scan case files to discover common problem symptoms and candidate solutions. |
Explore IBM Support Assistant
Your key to saving time on problem resolution
[{"Business Unit":{"code":"BU053","label":"Cloud \u0026 Data Platform"},"Product":{"code":"SSLLVC","label":"IBM Support Assistant"},"Component":"TeamServer","Platform":[{"code":"PF002","label":"AIX"},{"code":"PF016","label":"Linux"},{"code":"PF033","label":"Windows"}],"Version":"All Versions","Edition":"TeamServer","Line of Business":{"code":"","label":""}}]
Was this topic helpful?
Document Information
Modified date:
16 December 2022
UID
ibm10718131